Google vs Bing vs DuckDuckGo: Market Share and Differences in 2026
Compare Google, Bing, and DuckDuckGo market share, index differences, search volume, and ranking models in 2026. Learn when to tune for each search engine.
Dilshad Akhtar
Last updated: 11 July 2026
5 min read
TL;DRAI summary
- Google holds 90.39% global search share; Bing 5.03%; DuckDuckGo 0.71%
- In the US, Google drops to 84.17%, Bing rises to 10.48%, DuckDuckGo to 1.84%
- Google indexes separate mobile and desktop; Bing uses one device-agnostic index
- Bing weights social signals as ranking inputs; Google does not
- DuckDuckGo pulls primarily from Bing index, then strips identifiers
- Target Google first, Bing second, DuckDuckGo as a secondary privacy surface
Google commanded 90.39% of global search in May 2026, Bing sat at 5.03%, and DuckDuckGo at 0.71%. Each engine has a different index, different ranking model, and different tuning requirements.
Search engine market share at the global level
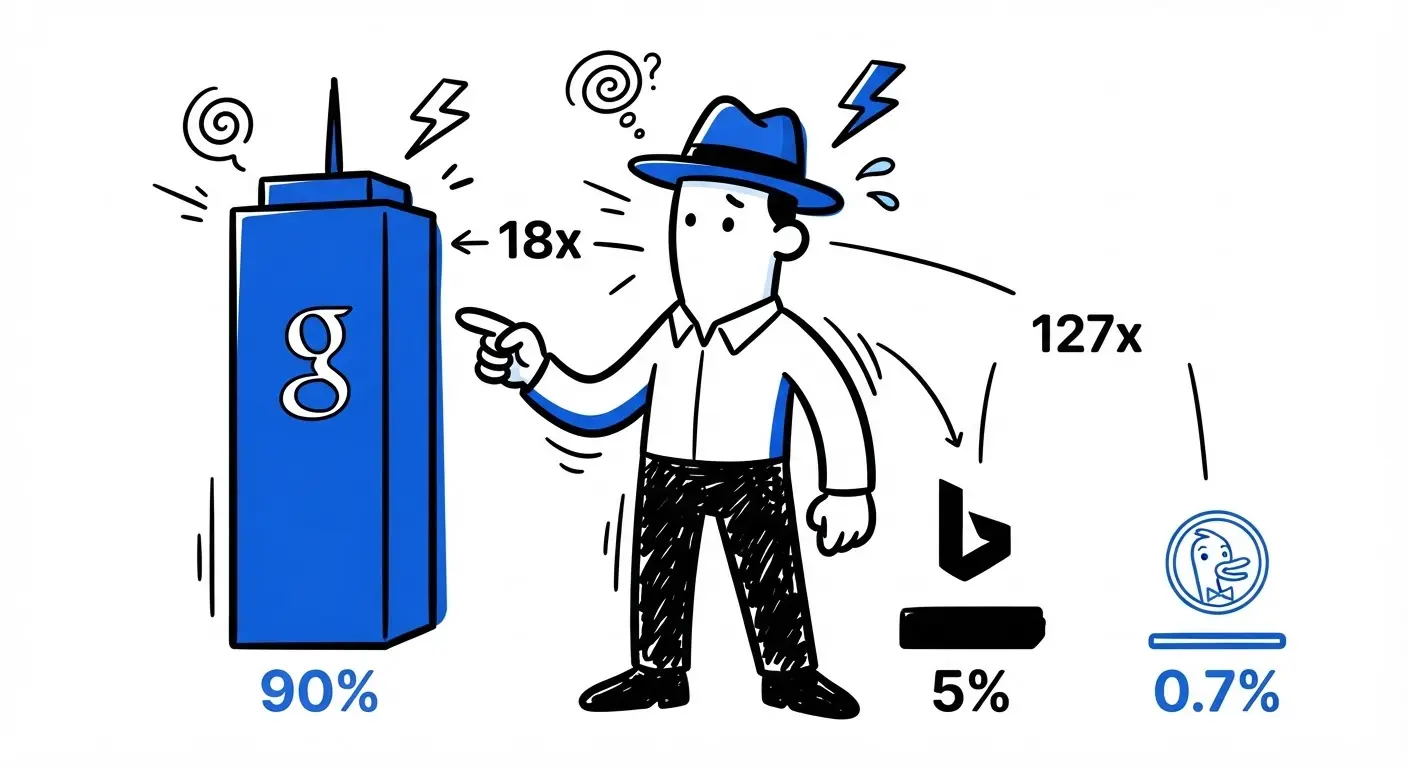
Google commanded 90.39% of global search in May 2026, per Statcounter rolling twelve-month measurement across 5B+ monthly page views. Bing sat at 5.03%. DuckDuckGo at 0.71%.
The math is stark. Google share is roughly 18x Bing and 127x DuckDuckGo at the global level. Three engines, one dominant operator.
US numbers diverge. Google dropped to 84.17% in the United States by March 2026. Bing rose to 10.48%. DuckDuckGo climbed to 1.84%, per Alphametic analysis of StatCounter country-level data.
Bing has structural advantages in the US, embedded in Windows 11 defaults and Microsoft 365 surfaces. The 10.48% US figure reflects that distribution.
Where each engine index differs

Google indexes a separate mobile and desktop corpus, then ranks from the mobile-first index. Bing operates a single device-agnostic index, per Impression Digital 2026 search engine comparison. The render path differs on both.
Bing weights social signals. Likes, shares, and retweets count as ranking inputs. Google does not. Bing auto-interprets 302 redirects as 301s after a few crawls. Google may leave them soft.
JavaScript rendering succeeds more often on Google than Bing. Both still index the underlying HTML. Site speed and content freshness weigh on both ranking models.
DuckDuckGo does not crawl the open web at scale. It pulls results primarily from Bing index and several vertical sources, then strips identifiers. Privacy is the product. Index freshness follows Bing crawl cycle.
Search volume and infrastructure scale
Google handled roughly 1 billion daily active users in 2026, per Impression Digital 2026 benchmark. Bing handled 100 million. DuckDuckGo averaged 98.8 million daily searches, per Electroiq 2025 DuckDuckGo statistics report.
The query count is misleading. Bing 100 million concentrates in commercial verticals where ad load is higher. DuckDuckGo 98 million is fragmented across 70+ million users who treat it as a secondary tool. Different denominators, different revenue shape.
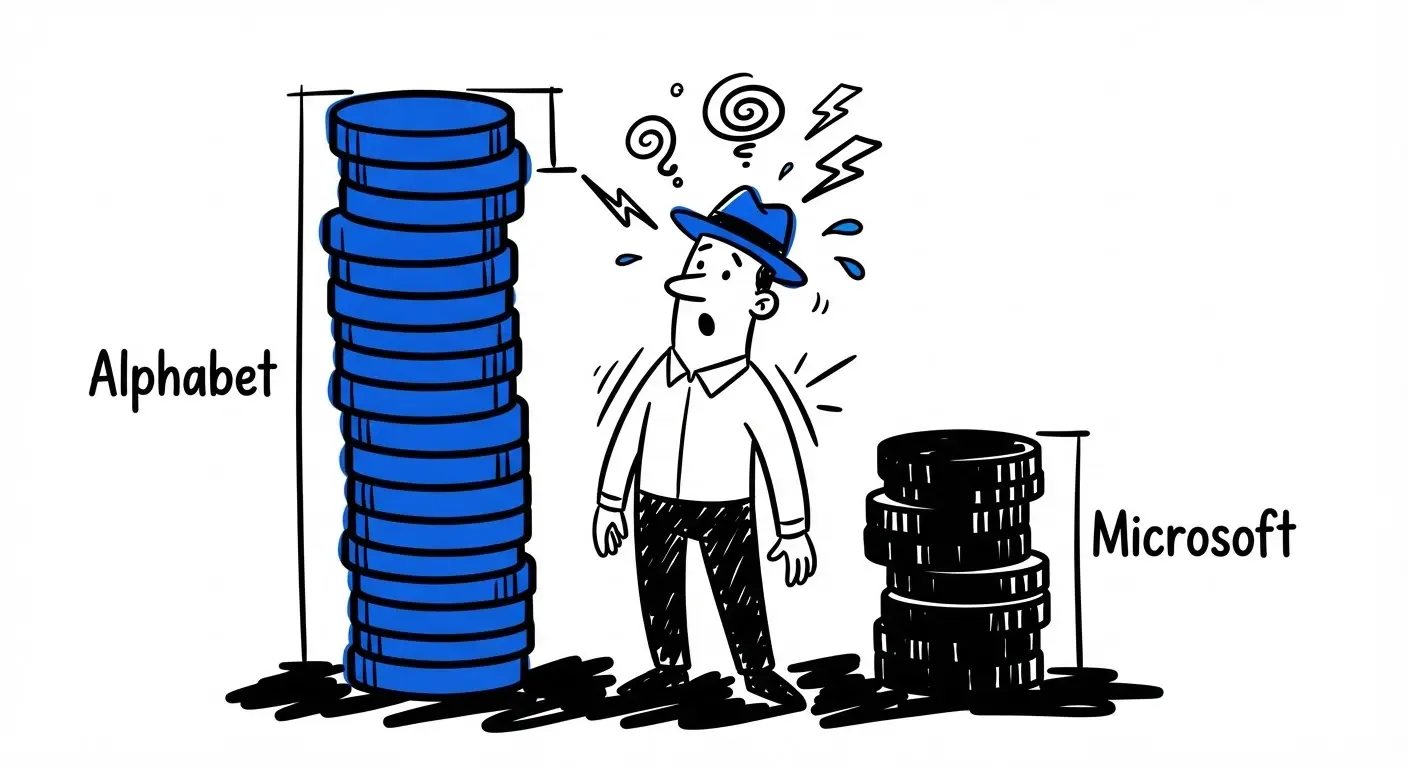
Revenue concentration is sharper. Alphabet crossed 400 billion dollars in annual revenue in FY2025. Microsoft FY26 Q2 hit 81.3 billion dollars, with search and news advertising up 10% year over year, per Impression Digital 2026 financials review.
The cross-engine rank check

Friday afternoon rolls around. You have a new landing page live. You run the query across Google, Bing, and DuckDuckGo in incognito and compare position, snippet, and image pack. The expected rank gap shows up before Search Console processes the new URL.
You inspect the differences. Bing rewards social proof signals Google ignores. DuckDuckGo returns Bing-sourced results with stripped metadata. The tuning work differs across engines.
Your title tag matters more on Bing. Your structured data matters more on Google. Your privacy posture is the moat on DuckDuckGo. Three engines, three ranking models, three separate tuning jobs.
Note the gap. This post cites four primary sources: StatCounter, Alphametic, Impression Digital, Electroiq. Three other market share trackers (Statista, SimilarWeb, comScore) carry public 2025 numbers but diverge by methodology. Pick one, hold its numbers across reports.
The search engine market share comparison
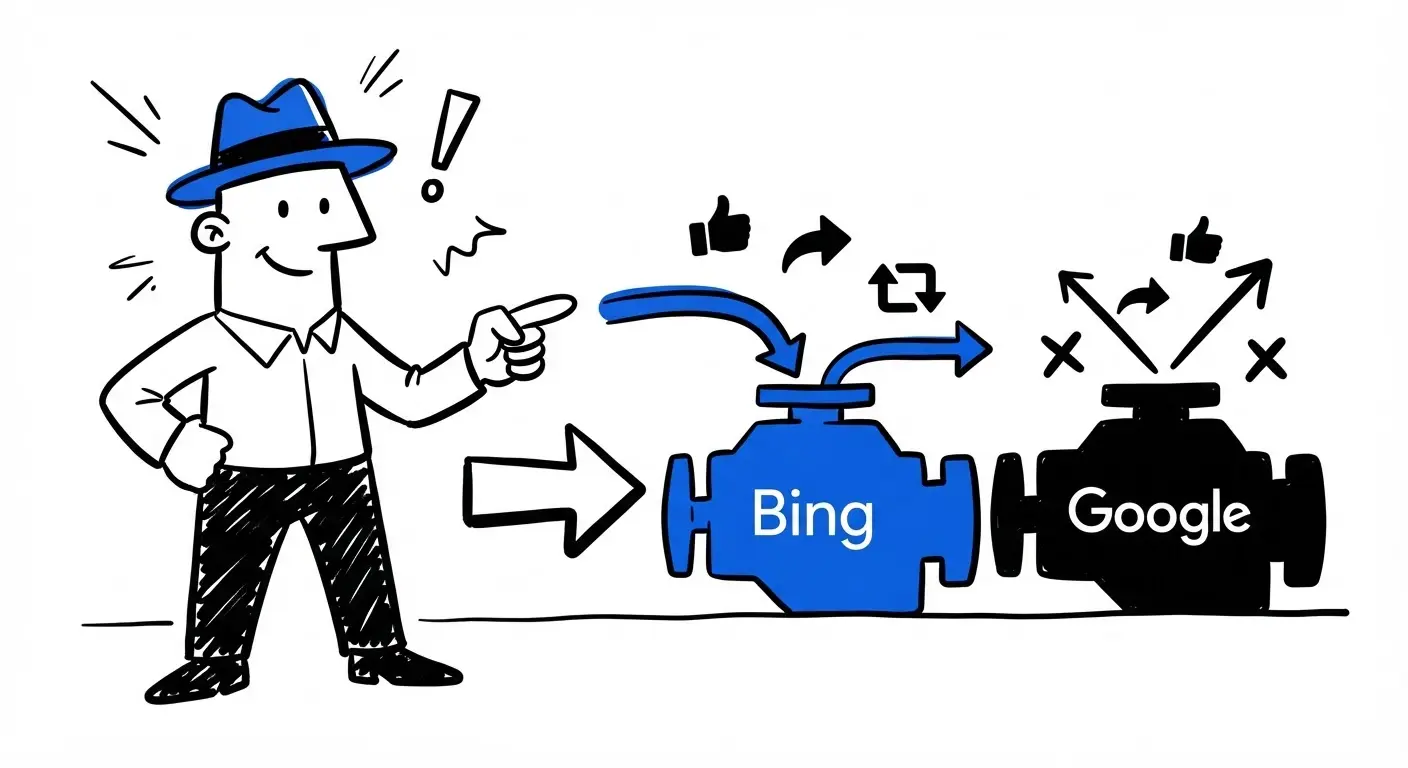
Google wins the volume war. Ninety percent of global queries flow through one infrastructure stack. The other 10% splits across Bing, DuckDuckGo, Yahoo, Yandex, and a long tail of regional engines.
Bing wins the Windows ecosystem and the social-signals category. DuckDuckGo wins privacy. Three engines, three bets, three different infra stacks. No single engine owns every vertical.
Target Google first. Ninety percent of your traffic sits there and the SERP changes faster than the other two combined. Tune Bing next. Commercial queries on Bing carry less SERP clutter and lower CPC competition.
Treat DuckDuckGo as a privacy-aligned secondary surface, not a primary acquisition channel. The 0.71% global share understates its role for technical, security-focused, and dev-tool audiences. Different bets, different measurement.
Related Articles
Discover more insights about web development and digital marketing